Italy NCOV-19 outbreak
For personal reasons I am trying to track the number of NCOV-19 confirmed cases in Italy as well as the number of deaths (since I live in Italy, it is not difficult to guess the personal reason…). I am thus regularly monitoring news from the italian official sources like “Regione Lombardia” and “Protezione Civile”.
2018
I live in Italy, and more precisely in Milan, a city known for fashion and design events. During a lunch break I was visiting the Pinacoteca di Brera, a 200 centuries old museum. This museum is full of incredible paintings from the Renaissance period. During my visit I was particularly impressed from one of them: “La Vergine con il Bambino, angeli e Santi”, by Piero della Francesca.
2016
we all know R is the first choice for statistical analysis and data visualisation, but what about big data munging? tidyverse (or we’d better say hadleyverse 😏) has been doing a lot in this field, nevertheless it is often the case this kind of activities being handled from some other coding language. Moreover, sometimes you get as an input pieces of analyses performed with other kind of languages or, what is worst, piece of databases packed in proprietary format (like .dta .xpt and other). So let’s assume you are an R enthusiast like I am, and you do with R all of your work, reporting included, wouldn’t be great to have some nitty gritty way to merge together all these languages in a streamlined workflow?
I am really enjoying Uefa Euro 2016 Footbal Competition, even because our national team has done pretty well so far. That’s why after browsing for a while statistics section of official EURO 2016 website I decided to do some analysis on the data they share ( as at the 21th of June).
Just to be clear from the beginning: we are not talking of anything too rigourus, but just about some interesting questions with related answers gathered mainly through data visualisation.
Ah, writing a blog post! This is a pleasure I was forgetting, and you can guess it looking at last post date of publication: it was around january... you may be wondering: what have you done along this long time? Well, quite a lot indeed:
-
changed my job ( I am now working @ Intesa Sanpaolo Banking Group on Basel III statistical models)
-
became dad for the third time (and if you are guessing, it’s a boy!)
tags: algorithm /analytics /apps /computer science /data analysis /data analytics /Github /R /Rstudio /shiny /shiny apps /social media /social media analytics /tutorials /web query /
2015
It was around midnight here in Italy: I shared the code on Github, published a post on G+, Linkedin and Twitter and then went to bed.
In the next hours things got growing by themselves, with pleasant results like the following:
https://twitter.com/DoodlingData/status/635057258888605696
The R community found ramazon a really helpful package.
And I actually think it is: Amazon AWS is nowadays one of the most common tools for online web applications and websites hosting.
The last Report to the Nation published by ACFE, stated that on average, fraud accounts for nearly the 5% of companies revenues.
on average, fraud accounts for nearly the 5% of companies revenues

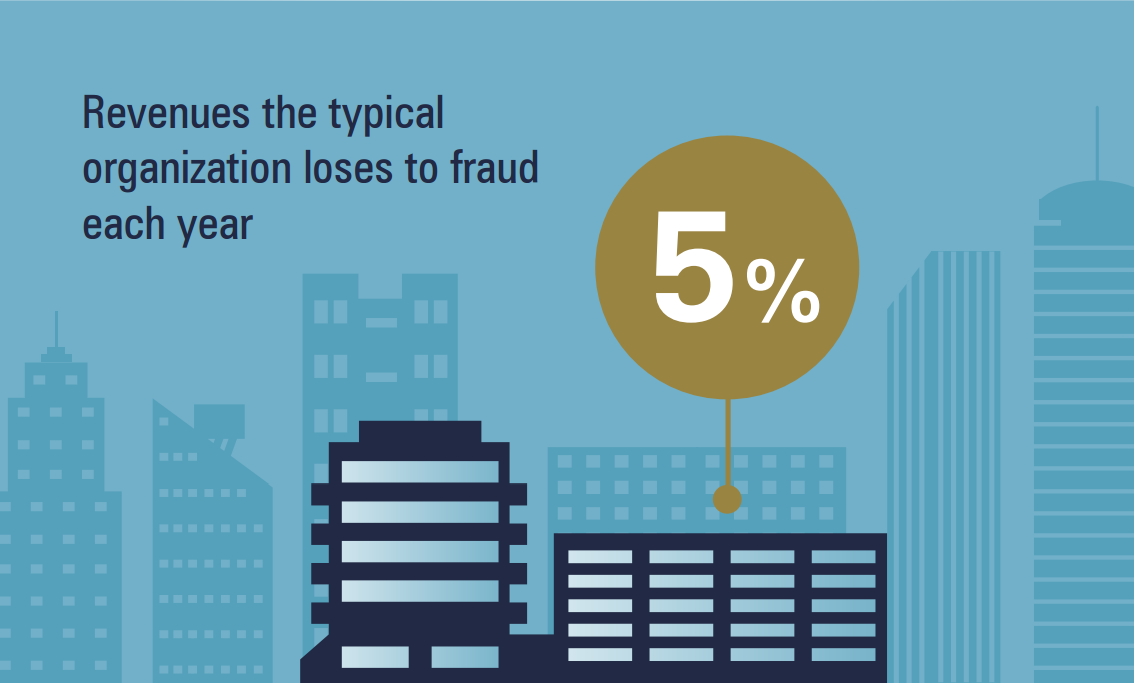
Projecting this number for the whole world GDP, it results that the “fraud-country” produces something like a GDP 3 times greater than the Canadian GDP.
- In the early ‘900 Frank Benford observed that ’1’ was more frequent as first digit in his own logarithms manual.
- More than one hundred years later, we can use this curious finding to look for fraud on populations of data.
- just give a try to the shiny app
- What ‘Benford’s Law’ stands for?
- Nice stuff, but what can I do with Benford’s Law?
- You can find fraud with it
- Some precautions
- BenfordeR: another lean shiny application
- What’s next
In the early ‘900 Frank Benford observed that ’1’ was more frequent as first digit in his own logarithms manual.
More than one hundred years later, we can use this curious finding to look for fraud on populations of data.
What ‘Benford’s Law’ stands for?
Around 1938 Frank Benford, a physicist at the General Electrics research laboratories, observed that logarithmic tables were more worn within first pages: was this casual or due to an actual prevalence of numbers near 1 as first digits?
2014
The main reason why
After all, I am still an Internal Auditor. Therefore I often face one of the typical internal auditors problems: understand links between people and companies, in order to discover the existence of hidden communities that could expose the company to unknown risks.
the solution: linker
In order to address this problem I am developing Linker, a lean shiny app that take 1 to 1 links as an input and gives as output a network map:
I reproduce here below principles from the amazing paper Best Practices for Scientific Computing, published on 2012 by a group of US and UK professors. The main purpose of the paper is to “teach” good programming habits shared from professional developers to people that weren’t born developer, and became developers just for professional purposes.
Scientists spend an increasing amount of time building and using software. However, most scientists are never taught how to do this efficiently
Best Practices for Scientific Computing
Write programs for people, not computers.
1. _a program should not require its readers to hold more than a handful of facts in memory at once_


2. _names should be consistent, distinctive and meaningful_


3. _code style and formatting should be consistent_


4. _all aspects of software development should be broken down into tasks roughly an hour long<!-- more -->_
Automate repetitive tasks.
1. _rely on the computer to repeat tasks_


2. _save recent commands in a file for re-use_


3. _use a build tool to automate scientific workflows_
Use the computer to record history.
1. _software tools should be used to track computational work automatically_
Make incremental changes.
1. _work in small steps with frequent feedback and course correction_
Use version control.
1. _use a version control system_


2. _everything that has been created manually should be put in version control_
Don’t repeat yourself (or others).
1. _every piece of data must have a single authoritative representation in the system_


2. _code should be modularized rather than copied and pasted_


3. _re-use code instead of rewriting it_
Plan for mistakes.
1. _add assertions to programs to check their operation_


2. _use an off-the-shelf unit testing library_


3. _use all available oracles when testing programs_


4. _turn bugs into test cases_


5. _use a symbolic debugger_
Optimize software only after it works correctly.
1. _use a profiler to identify bottlenecks_


2. _write code in the highest-level language possible_
Document design and purpose, not mechanics.
1. _document interfaces and reasons, not implementations_


2. _refactor code instead of explaining how it works_


3. _embed the documentation for a piece of software in that software_
Collaborate.
1. _use pre-merge code reviews_


2. _use pair programming when bringing someone new up to speed and when tackling particularly tricky problems_
if you want to discover more, you can download your copy of Best Practice Scientific Computing here below
as part of the** excel functions in R,** I have developed this custom function, reproducing the excel right() function in th R language. Feel free to copy and use it.
[code language=“r”] right = function (string, char){ substr(string,nchar(string)-(char-1),nchar(string))} [/code]
you can find other function in the Excel functions in R post.
as part of the excel functions in R, I have developed this custom function, emulating the excel left() function in th R language. Feel free to copy and use it.
left = function (string,char){
substr(string,1,char)}
you can find other function in the** Excel functions in R post**.
Following the post about %in% operator, I received this tweet: https://twitter.com/benwhite21/status/510520550553165824
I gave a look to the code kindly provided by Ben and then I asked myself: I know dplyr is a really nice package, but which snippet is faster?
to answer the question I’ve put the two snippets in two functions:
#Ben snippet dplyr_snippet =function(object,column,vector){ filter(object,object[,column] %in% vector) } #AC snippet Rbase_snippet =function(object,column,vector){ object[object[,column] %in% vector,] }
Then, thanks to the great package microbenchmark, I made a comparison between those two functions, testing the time of execution of both, for 100.000 times.

I’ve been recently asked to analyze some Board entertainment expenditures in order to acquire sufficient assurance about their nature and responsible.
In response to that request I have developed a little Shiny app with an interesting reactive Bubble chart.
The plot, made using ggplot2 package, is composed by: a categorical x value, represented by the clusters identified in the expenditures population A numerical y value, representing the total amount expended Points defined by the total amount of expenditure in the given cluster for each company subject. Morover, point size is given by the ratio between amount regularly passed through Account Receivable Process and total amount of expenditure for that subject in that cluster.