introducing vizscorer: a bot advisor to improve your ggplot plots
One of the most frustrating issues I face in my professional life is the plentitude of ineffective reports generated within my company. Wherever I look around me is plenty of junk charts, like barplot showing useless 3D effects or ambiguous and crowded pie charts. I do understand the root causes of this desperate state of the art: people have always less time to dedicate to reports crafting, and even less to dedicate to their plot. In the crazy and speedy-going working life, my colleagues have no time and for learning data visualization principles. Even so, this remains quite a big problem since a lot of time and money-wasting consequences come from poorly crafted reports and plots:
I personally really appreciate the InstallR package from Tal galilli, since it lets you install a great number of tools needed for working with R just running a function.
2016
Ah, writing a blog post! This is a pleasure I was forgetting, and you can guess it looking at last post date of publication: it was around january... you may be wondering: what have you done along this long time? Well, quite a lot indeed:
-
changed my job ( I am now working @ Intesa Sanpaolo Banking Group on Basel III statistical models)
-
became dad for the third time (and if you are guessing, it’s a boy!)
tags: algorithm /analytics /apps /computer science /data analysis /data analytics /Github /R /Rstudio /shiny /shiny apps /social media /social media analytics /tutorials /web query /
2015
It was around midnight here in Italy: I shared the code on Github, published a post on G+, Linkedin and Twitter and then went to bed.
In the next hours things got growing by themselves, with pleasant results like the following:
https://twitter.com/DoodlingData/status/635057258888605696
The R community found ramazon a really helpful package.
And I actually think it is: Amazon AWS is nowadays one of the most common tools for online web applications and websites hosting.
The last Report to the Nation published by ACFE, stated that on average, fraud accounts for nearly the 5% of companies revenues.
on average, fraud accounts for nearly the 5% of companies revenues

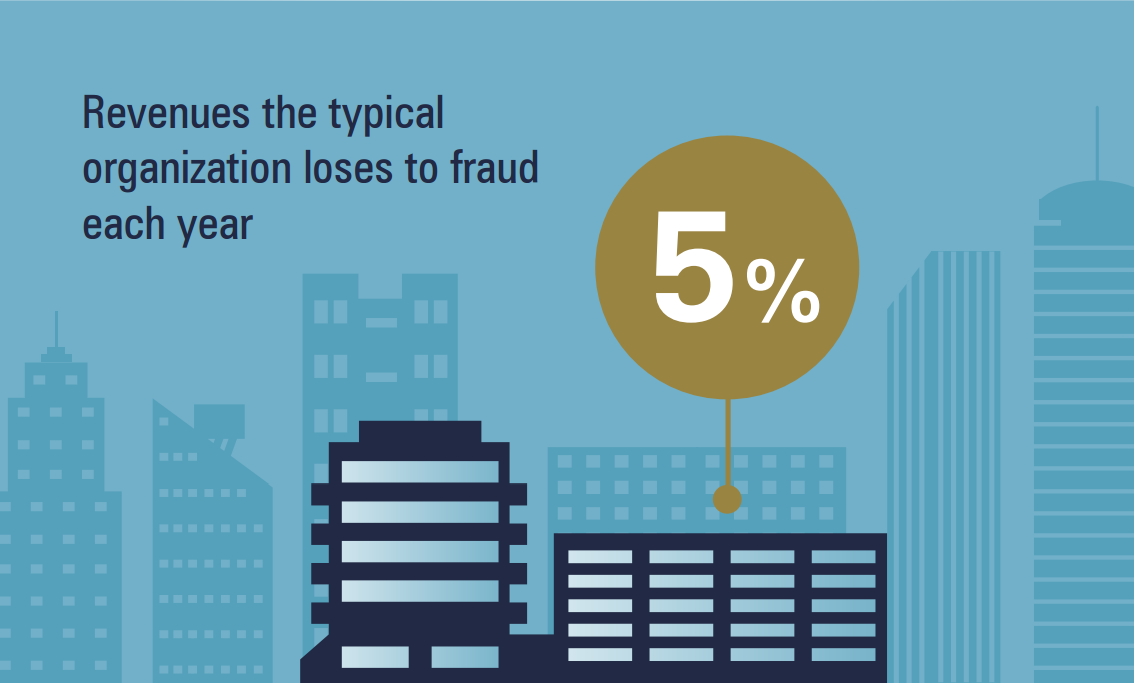
Projecting this number for the whole world GDP, it results that the “fraud-country” produces something like a GDP 3 times greater than the Canadian GDP.
- In the early ‘900 Frank Benford observed that ’1’ was more frequent as first digit in his own logarithms manual.
- More than one hundred years later, we can use this curious finding to look for fraud on populations of data.
- just give a try to the shiny app
- What ‘Benford’s Law’ stands for?
- Nice stuff, but what can I do with Benford’s Law?
- You can find fraud with it
- Some precautions
- BenfordeR: another lean shiny application
- What’s next
In the early ‘900 Frank Benford observed that ’1’ was more frequent as first digit in his own logarithms manual.
More than one hundred years later, we can use this curious finding to look for fraud on populations of data.
What ‘Benford’s Law’ stands for?
Around 1938 Frank Benford, a physicist at the General Electrics research laboratories, observed that logarithmic tables were more worn within first pages: was this casual or due to an actual prevalence of numbers near 1 as first digits?
2014
If you have a blog you may want to discover how your website is performing for given keywords on Google Search Engine. As we all know, this topic is not a trivial one.
Problem is that the analogycal solution would be quite time-consuming, requiring you to search your website for every single keyword, on many many pages.
Feeling this way?
[caption id=“attachment_273” align=“aligncenter” width=“300”] “Pain and fear, pain and fear for me” - Oliver Twist[/caption]