I am really enjoying Uefa Euro 2016 Footbal Competition, even because our national team has done pretty well so far. That’s why after browsing for a while statistics section of official EURO 2016 website I decided to do some analysis on the data they share ( as at the 21th of June).
Just to be clear from the beginning: we are not talking of anything too rigourus, but just about some interesting questions with related answers gathered mainly through data visualisation.
We can divide following analyses into two main parts: a first part were we analyse distribution of fouls and their incidence on matches outcome and a second part where ball possession in analysed, once again looking at relationship between this stat and matches outcome. Let’s start with fouls then.
which team committed the greatest number of fouls?
Here we are with the first question. And here it is the answer:
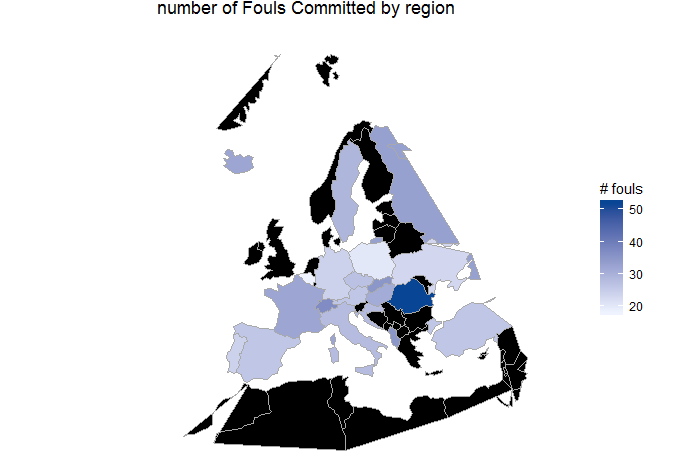
Given that black countries are countries not playing the competition it seams Romania committed quite a great number of fouls. You may wonder: were them serious fouls? Let’s have a look to the number of yellow and red cards to answer that legitimate question. Let’s start from yellow cards:
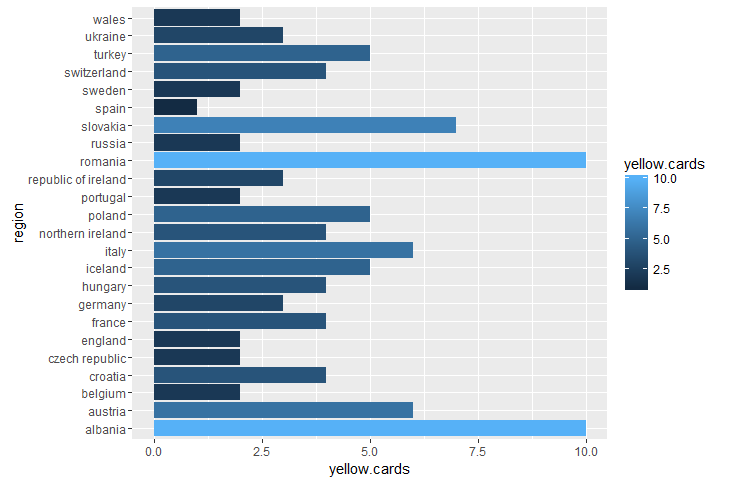
Well, Romania togheter with Albania is standing at the top of yellow cards ranking as well. Getting to red cards we have to underline that we dont’ have a lot of data about them, since just two of them were assigned. Guess to whom? Albania and Austria. All that summed up we can definitely say Albania am Romania played toughest matches overall. but was that worthing? Uhm I guess no, since both of them didn’t get trough staging phase. And this raise another interesting question:
is there a correlation between number of fouls and number of wins?
to answer this technically silly question we can try to plot total number of fouls against number of wins by country team. let’s have a look to the plot:
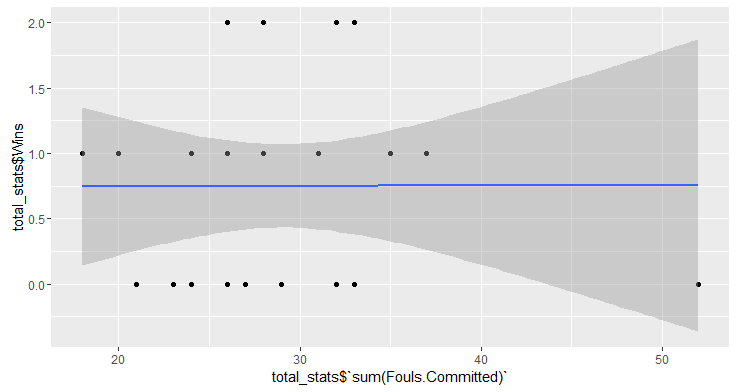
we added a linear regression model to the scatter plot to investigate the hyphotesis of linear relationship but nothing happened, so **no, committing more fouls is not a winning strategy. **Let us ask one last reasonable question:
is committing more fouls at least a good strategy in order to reduce goals against?
Once again let’s the data speak out:
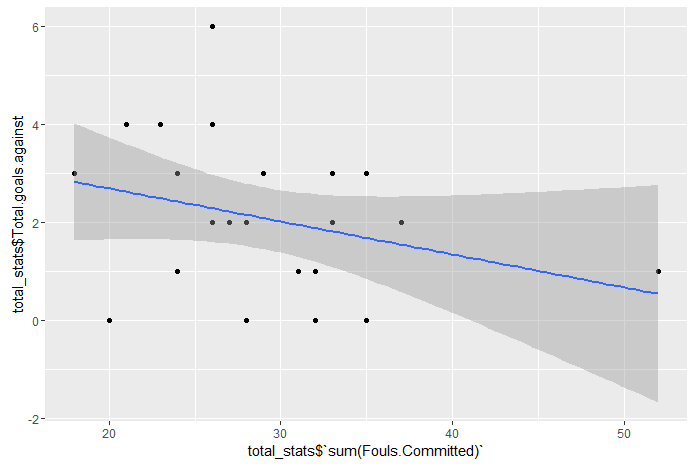
ok, it could seems we can answer a sound yes, but I get a bit disturbed by that 52 romanian fouls so I am going to try to remove them and plot again:
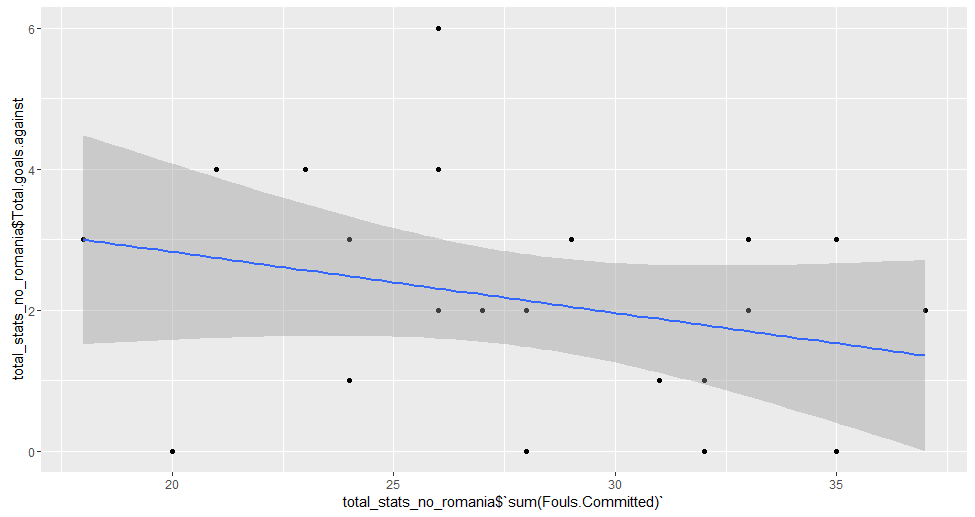
our first guess seems to be confirmed:number of fouls commited is negatively correlated to the number of goals against suffered, which appears to be reasonable since we may assume a great number of fouls are committed to stop rivals from dangerous game actions.
who’s keeping the ball more? ball possession stats
ball possession is a key start when analysing a football match, so let’s start answering this introductory question: who’s scoring the highest possession stat within this competition? Once again we can visualise it on a europe map:
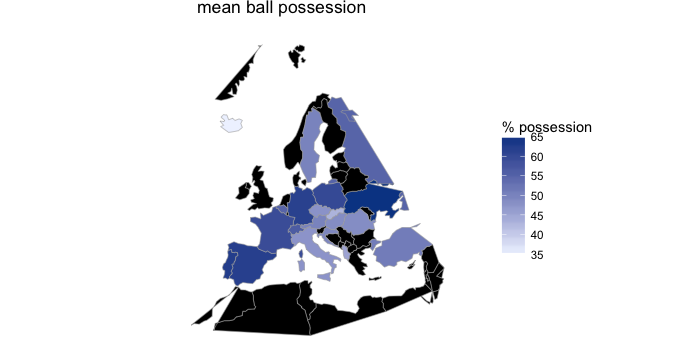
giving a closer look to first five teams by ball possession we find a prevalence of north western europe countries:
| Country | Mean Possession |
| Germany | 71% |
| ukraine | 65% |
| portugal | 62% |
| spain | 62% |
increasing ball possession increases winning likelihood?
we are going to tackle this visually, plotting percentage of ball possession against a “win_dummy” variable, scoring 1 for win and 0 for defeat:
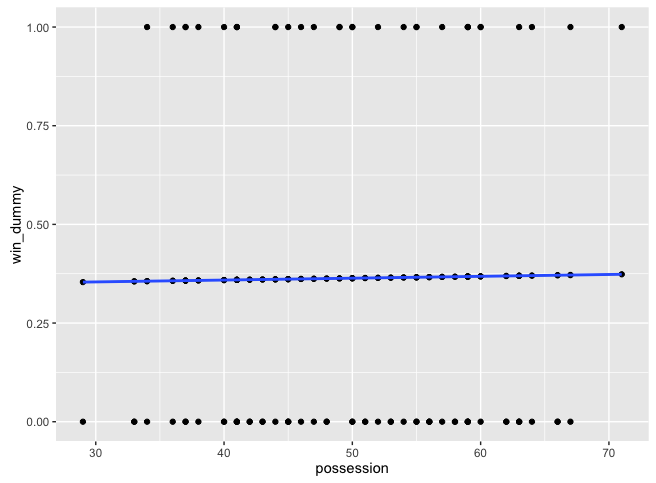
as you can see we have also added an estimated logistic regression which visually enforces the truth already visible from raw data: there is no positive correlation, and apparently no correlation at all, between ball possession and matches outcome.
Conclusions
within this post we tried to answer some questions about matches occured so far during UEFA EURO 2016 and we definitely found that being tough is not a good tactic to win your matches but at least can help you avoid suffering a great number of goals. Moreover we understood that ball possession is not related to matches outcome which seems to me a non obvious result. you can find below code employed for these analyses and if you are interested in reperforming them or even further explore raw data you can have a look to the Rstudio project I have uploaded on Github.
That said: may the best win!
[code language=“r”]
Load required packages
library(rio) library(plyr) library(dplyr) library(choroplethr) library(choroplethrMaps) library(ggplot2) library(dummies)
#data from http://www.uefa.com/uefaeuro/season=2016/statistics/index.html players_stat <- read.csv(‘players_stats.csv’,sep = “;”) players_stat$Team <- tolower(players_stat$Team) team_stat <- read.csv(‘team_stats.csv’ ,sep = “;”) team_stat$Team <- tolower(team_stat$Team) possession_stat <- read.csv(‘possession.csv’, sep = “;”) possession_stat$team <- tolower(possession_stat$team) #sum up fouls data from player view to team view by_team <- group_by(players_stat,Team) team_sums <- summarise(by_team, sum(Yellow.Cards), sum(Red.Cards), sum(Fouls.Committed), sum(Fouls.Suffered))
subset columns to plot only the number of fouls committed
fouls_data <- data.frame(“region” = team_sums$Team,“value” = team_sums$sum(Fouls.Committed))
plot
fouls_plot <- country_choropleth(fouls_data, title = “number of Fouls Committed by region”, legend = “# fouls”, num_colors = 1) + xlim(-31.266001, 39.869301) + ylim(27.636311, 81.008797) + coord_map(“lambert”, lat0 = 27.636311, lat1 = 81.008797) fouls_plot
#plot the number of yellow cards against country
ggplot(team_sums,aes(x = Team,y = sum(Yellow.Cards), fill = sum(Yellow.Cards) )) +
geom_bar(stat = ‘identity’) +
coord_flip()
merge team data
total_stats <- merge(team_sums,team_stat)
#plot fouls committed against number of wins by country
ggplot(total_stats,aes(x = total_stats$sum(Fouls.Committed),y = total_stats$Wins, label = Team)) +
geom_point() +
geom_text(nudge_y = 0.2) +
geom_smooth(method = ‘lm’, formula = y~x)
plot fouls committed against number of goals against
ggplot(total_stats,aes(x = total_stats$sum(Fouls.Committed),
y = total_stats$Total.goals.against, label = Team)) +
geom_point() +
geom_text(nudge_y = 0.2) +
geom_smooth(method = ‘lm’, formula = y~x)
#remove romania and plot again total_stats_no_romania <- total_stats[-16,]
ggplot(total_stats_no_romania,aes(x = total_stats_no_romania$sum(Fouls.Committed),
y = total_stats_no_romania$Total.goals.against, label = Team)) +
geom_point() +
geom_text(nudge_y = 0.2) +
geom_smooth(method = ‘lm’,formula = y~x)
ball possession analysis
#split dataset and merge back in order to have one record for each team possession_a <- possession_stat[,-c(4,8)] possession_a$win <- possession_a$score > possessiona$score possession_b <- possession_stat[,-c(3,7)] possession_b$win <- possession_b$score < possessionb$score possession_a <- possession_a[,-5] possession_b <- possession_b[,-4] colnames(possession_b) <- colnames(possession_a) possession_tidy <- rbind(possession_a,possession_b) dummy_win <- as.data.frame(dummy(possession_tidy$win)) possession_tidy$win_dummy <- dummy_win[,2]
#country possession stats
by_team_pos <- group_by(possession_tidy,team) team_means <- summarise(by_team_pos, mean(possession)) colnames(team_means) <- c(“region”,“value”)
possession_plot <- country_choropleth(team_means, title = “mean ball possession”, legend=“% possession”, num_colors=1)+ xlim(-31.266001, 39.869301)+ ylim(27.636311, 81.008797) + coord_map(“lambert”, lat0=27.636311, lat1=81.008797) possession_plot
#logistic regression
ggplot(data = possession_tidy,aes(x = possession)) + geom_point(aes(y = win_dummy)) + stat_smooth(aes(y = win_dummy),method = “glm”) [/code]