- In the early ‘900 Frank Benford observed that ’1’ was more frequent as first digit in his own logarithms manual.
- More than one hundred years later, we can use this curious finding to look for fraud on populations of data.
- just give a try to the shiny app
- What ‘Benford’s Law’ stands for?
- Nice stuff, but what can I do with Benford’s Law?
- You can find fraud with it
- Some precautions
- BenfordeR: another lean shiny application
- What’s next
In the early ‘900 Frank Benford observed that ’1’ was more frequent as first digit in his own logarithms manual.
More than one hundred years later, we can use this curious finding to look for fraud on populations of data.
What ‘Benford’s Law’ stands for?
Around 1938 Frank Benford, a physicist at the General Electrics research laboratories, observed that logarithmic tables were more worn within first pages: was this casual or due to an actual prevalence of numbers near 1 as first digits?
Starting from this intuition/question, Benford tested the hypothesis against 30 populations of data, finally coming to what is known as the Benford Law:
the expected frequencies of the digits in lists of numbers
LogaritmeTafel
That is to say that using the Benford Law is possible to make a prediction about the expected distribution of a population of data, in term of recurrence of numbers from 1 to 9 as first digits.
The prediction is made in term of probability, and is calculated using the following formula:
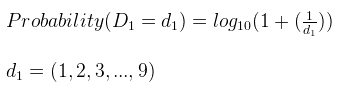
You can also calculate the conditional probability of having two numbers as the first two digits:
A typical “Benford Distribution” looks really left skewed, having the first two numbers nearly the 50% of probability of being the first digit.

Nice stuff, but what can I do with Benford’s Law?
Until a certain point in mathematical history, Benford’s Law was regarded as a bizzare feature of some populations of data.
Something really amusing, but not really useful.
Eventually, mainly due to the meritory work of the mathematicianMark Nigrini, Benford’s law began to be used for practical purposes, and more precisely for Fraud Analytics purposes.
You can find fraud with it
The idea of using Benford Law for Fraud Analytics purposes is based on one of the main assumptions in Fraud Analytics:
“if something is behavouring differently from what it should, it could be due to fraud.”
In the case of Benford’s Law the aim of using it for catching fraud is to verify if the law is respected within the population and if not, wich elements are not respecting it.
Of course, as is always the case for fraud analytics, the anomaly could be due to human error, at least for some of the anomalies ( i.e. false alarm).
Nevertheless, Benford-based fraud analysis has proven to be a very effective tool for detecting fraud, especially considering the non compliance as a red-flag on the data integrity.
Some precautions
As pointed out by Durtschi,Hillison and Pacini, you have to be cautious when using Benford’s Law.
Particularly, Benford’s Law is unlikely to be useful in the following cases:
| Data set is comprised of assigned numbers | Check numbers, invoice numbers, zip codes |
| Numbers that are influenced by human thought | Prices set at psychological thresholds ($1.99), ATM withdrawals |
| Accounts with a large number of firm-specific numbers | An account specifically set up to record $100 refunds |
| Accounts with a built in minimum or maximum | Set of assets that must meet a threshold to be recorded |
| Where no transaction is recorded | Thefts, kickbacks, contract rigging |
BenfordeR: another lean shiny application
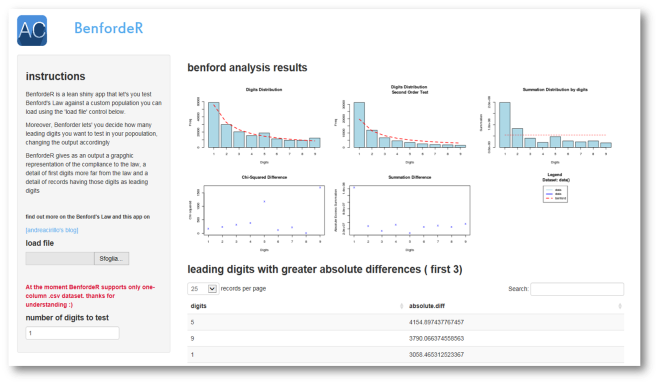
Because I am getting used to do it ( and also because my readers seems to find it useful) I developed a lean shiny app in R, that let’s you play around with Bendford law, loading your own population and looking for Benford’s law compliance ( no worry, a demo dataset is also provided).
BenfordeR’s main feature includes:
custom dataset upload
number of first digits to test option
suspected records higlight ( se below ’detecting suspected records)
##Some code specs ( if you are interested in)
Complete, and commented, Rstudio Project is given on GitHub, but I would like to point out some code details in the following lines.
performing a benford analysis
BenfordeR is based on benford.analysis package, a well documented package that lets you simply perform a Benford analysis, using a single function: benford().
benford_obj = reactive({benford(data(),input$digits)})plotting results
benford() function returns a benford objects that can be easily visualised using the plot function:
plot(benford_obj())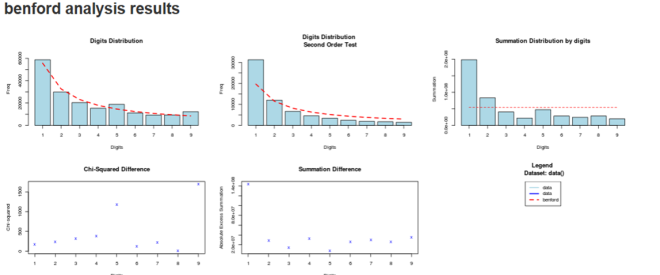
detecting suspected records
Finally, in order to allow the user to easily discover wich records are causing the anomaly, BenfordeR selects the first three digits in term of deviance from the expected recurrence and subset the user dataset looking for these digits:
output$benford_suspect = renderDataTable({
 digits= left(data(),input$digits) # extract n digits from the data() table, using the left function
 data_output= data.frame(data(),digits)# join the digits with the dataset
 suspects= suspectsTable(benford_obj()) # this could be improved using benford_table()
suspects= suspects[1:3,] #see above
suspects_digits= (as.character(suspects$digits))
data_suspected = subset(data_output,as.character(data_output[,2])%in% suspects_digits)}) # filter the data based on first three suspected digits
What’s next
I approached Benford’s Law as a part of my Internal Audit job and as a part of my bachelor’s thesis.
More precisely, I am currently developing a fraud-scoring algorithm that take advantage from different anomaly-detection algorithms.
Walking along this path, I have further developed BenfordeR as a “module” within the fraud-scoring algorithim and the related Shiny App. The result of this development is Afraus, an unsupervised fraud detection algorithm. Find out more on Afraus reading the dedicated post.
![]()